Stellantis was formed from a merger between Fiat Chrysler and Groupe PSA in 2021 and is currently the 5th largest automaker in the world. The stock has been at our highest risk rating of ‘10’ since Q4 24 and H1 numbers on Tuesday saw no change to that rating. The disclosures in the H1 report confirm many of the trends we had already identified from the 2024 annual report.
Many of these flags are rooted in the growing financialisation of the company (both on balance sheet and off balance sheet), which increasingly appears to be driving fundamentals. The rapid growth in capital being deployed is particularly striking given it is occurring in an environment where overall auto shipments are down. Our focus here is on two key elements: The expansion of the financial services balance sheet and the growing network of financing JVs, which we analyse in turn below:
One of the most striking disclosures came from transactions with related parties (extract below). We can see here growth in sales to “Joint arrangements and associates” growing over 50% from €4.6bn to €7.0bn, even as overall vehicle shipment fell by 8% YoY. In H1, sales to related parties now represent over 10% of vehicle sales.
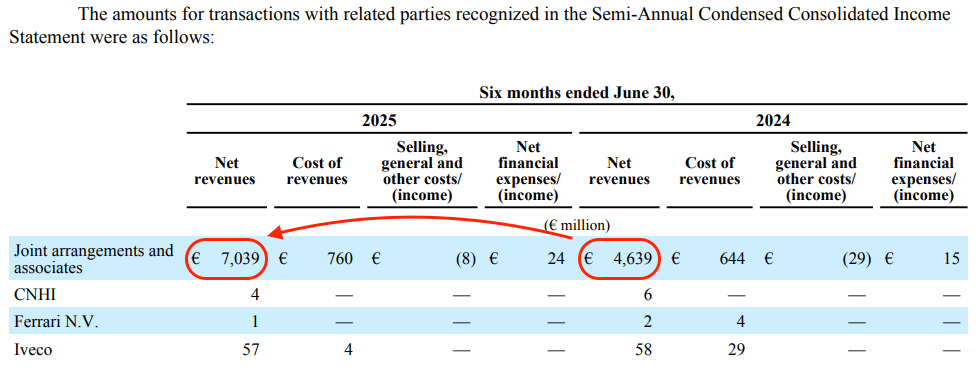
The joint arrangements and associates referenced here refer to a network of JVs that have been established across Europe with Santander Consumer Finance (“SCF”) and BNP Paribas Personal Finance (“BNPP PF”). Detailed disclosure of the Santander JVs in the annual report tells us that these JVs hold financial assets totalling $36bn, most of which we believe will be leased vehicles. While there is nothing inherently wrong with the use of such financing JVs, the sudden ramp up in growth suggests a relaxation of underwriting discipline in pursuit of higher sales.
While the JVs are not consolidated, Stellantis retains material exposure. The annual report shows a carrying value of these JVs of €3.1bn on the balance sheet. In addition there are receivables outstanding from these JVs of €1.1bn (primarily related to the extension of subordinated loans to the JVs) and a guarantee of €0.5bn (of which €250m is outstanding after a partial expiry in July 25).
Disclosure for H1 25 doesn’t give a detailed breakdown for these specific JVs, but we can see a further jump in overall receivables outstanding from joint arrangements and associates: From €2.2bn to €3.2bn in just 6 months (see extract below)
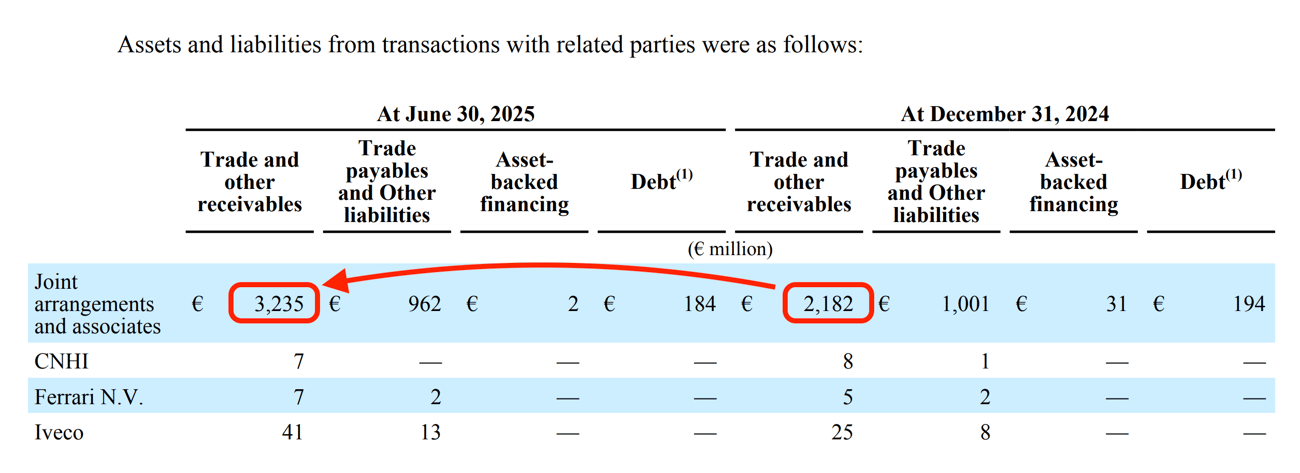
Apart from the financial exposure here, Stellantis may struggle to sustain this source of growth without further capital injections from the parent companies. As leased assets build, this also creates a risk of elevated ‘channel’ inventory
Stellantis encourages the market to focus on “Industrial FCF” as the key cash flow metric. At the time of Q4 results, guidance was for industrial FCF to turn positive 2025. However this guidance was suspended at the time of Q1 results. In H1 Industrial FCF came in at negative €3bn and the company’s guidance is now only for an improvement in H2 versus H1.
Investors should be aware however that free cash flow based on GAAP was far worse in H1, coming in at negative €7.4bn, a huge figure for a 6 month period and equivalent to about one third of the current market cap. The key difference between the two figures is due to the financial service business, which witnessed a total outflow of EUR 4.4bn in H1 (a sharp increase from the €2.4bn outflow in H1 24). This number is stripped out of the “Industrial FCF” figure, as we can see from the reconciliation below.
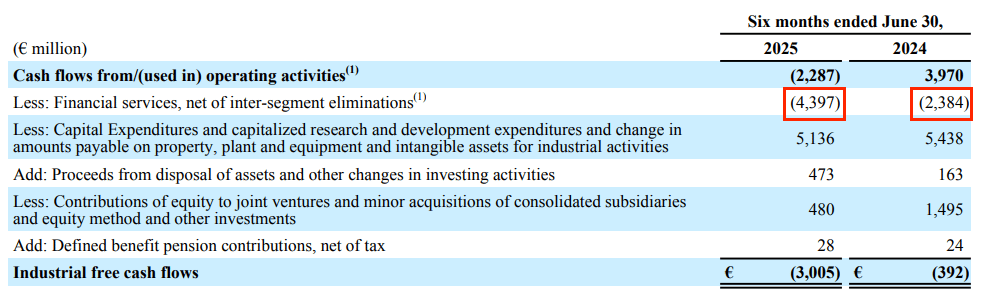
Management may argue that this allows investors to focus on the health of the core industrial business, but given the size of the outflow from financial services, we think it deserves more attention. The outflow for the financial services business comes from two key sources.
Firstly, there was an outflow of €2.8bn for the purchase of leased vehicles. This represents internal sales of vehicles from the industrial business to the financial services business, where they are leased to customers. Of course, the physical cars are still there on the balance sheet and remain the property of Stellantis, but they have been reclassified from inventory to “leased assets”. This is presented as a cash inflow for the industrial business and a cash outflow for the financial services business. A look at the balance sheet shows this stock appearing as two separate items, both of which have seen a sharp expansion.
1. “Assets Subject to Operating Leases”. FY24 saw significant expansion of this item as it grew from €5.6bn to €10.1bn. Disclosure of this item is not available for H1 25, but given the €2.8bn of purchases we expect it has continued to grow.
2. “Assets sold with a buy-back commitment” where the term of the contract is less than 12 months. This grew from €1.3bn in 2023 to €1.9bn by the end of 2024, then again to €2.9bn in H1 25.
Much like with the financing JVs, there is a clear incentive to relax underwriting standards and/or accept lower returns for the financing business in pursuit of moving cars out of inventory. Every car ‘sold’ to the financing business will benefit industrial free cash flow (which the market is focused on) at the expense of the financial services cash flow (which the market is much less focused on). As mentioned above, this expansion might not feel so anomalous were it not happening in an environment of overall declining shipments.
Secondly, there was an outflow of $1.7bn related to an increase in receivables from financing activities, which typically relate to dealer and retail financing. Again, since this sits within the financial services business, it is being excluded from industrial free cash flow. Much of the expansion seems to be coming from Stellantis Financial Services (“SFS”) which provides financing to dealers and customers in the US. The annual report shows that wholesale lines of credit to dealers via SFS grew from 3% of the network in 2023 to 6% of the network in 2024.
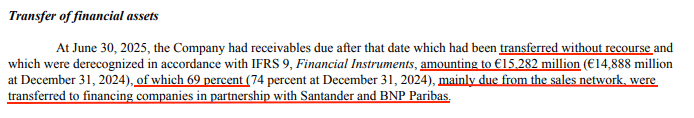
Note also that Stellantis engages in a massive factoring program, with over €15bn of outstanding receivables transferred as at the end of June (see extract below). What's more, the disclosure tells us that for 69% of these receivables, the counterparty is “financing companies in partnership with Santander and BNP Paribas”. These would seem to be the same financing JVs mentioned above, in which case they are effectively using their own JVs to provide funding to the group.
All this points towards a company assertively using its balance sheet and JV structure to absorb inventory and to stimulate sales. This raises a number of questions for investors around increased risk profile, sustainability of demand and growing levels of inventory outside of the balance sheet.
Continuing Stellantis’s penchant for the JV structure, Stellantis has established a number of JVs to supply auto components. Key entities include ACC (JV with Mercedes-Benz and TotalEnergies/Saft), NextStar Energy (JV with LG Energy Solutions) and StarPlus Energy (JV with Samsung SDI), all of which are battery producers. From an accounting perspective, setting these up as JVs allows Stellantis to classify spending as an investment, versus incurring the large start-up expenses for these gigafactories were the activity to be consolidated.
These JVs have started to ramp up production in 2024/2025 so we expect the capital required here could be material. In addition Stellantis has granted the following material guarantees
With a structure this complex we don’t envy the job of the new CEO, Antonio Filosa, who took the wheel only a couple of months ago. As an operations guy we wonder how long it takes to get a proper grasp on the flows of capital through the business and the accounting - to an extent we think he’ll be relying on the (slightly) more established CFO, Doug Ostermann. If fundamentals improve on the product side, this may buy the company some time. However if the environment remains tough in H2, we expect the drain on capital is going to become ever more obvious and this may force management into more drastic restructuring.
Our machine intelligence helps Portfolio Managers to spot critical red flags hidden deep within the financial statements and governance disclosures.
Forensic Alpha uses proprietary machine intelligence to identify risks hidden deep within the financial statements and governance disclosures.
Forensic Alpha Limited
Level 39, One Canada Square
Canary Wharf
London E14 5AB
Forensic Alpha US INC
12 East 49th Street
New York
NY 10017
USA